This article was written and published by The Pasch Group, shared here with permission. Download the full PDF here
Introduction
With automotive retailing experiencing significant headwinds, dealers are looking to optimize the conversion rates of their websites to increase sales opportunities. To help dealers optimize website conversion, we started a project to measure the overall form conversion rates (FCR) of their websites and a framework to measure the CTA Conversion Rate (CCR) of popular website software tools for trade, payment, credit, and service.
By measuring CCR, dealers can start to understand which online tools are easier for consumers to use which in turn increases sales opportunities for dealers.
TradePending is a popular vendor which provides dealers with website retailing tools. As we inspected dealership websites of members of the Automotive CXO Network, many websites had their trade software on their websites. Some of the stores only had their trade tool and others had what we call their Power CTA Stack: trade, payments, and credit. In this research report, we will share how overall website conversion rates improved when dealers added all three CTA buttons to their Vehicle Detail Pages when they previously only had trade tools.
Across OEM brands and website platforms, the TradePending retail tools created measurable lift (25-100%) in lead form conversions as measured by CRM reports.
However, one of the biggest revelations in this research was where we found the full story of website engagement and conversion rates. This could only be seen in Google Analytics (GA4) using the website shopper events which follow Automotive Standards Council (ASC) specification. When we looked at the Google Analytics data, the throughput of TradePending software set the high bar for the
automotive industry. When dealers take the time to understand the data which is freely provided in Google Analytics and compare those numbers to what is found in the CRM, website conversion optimization insights will emerge. For a full discussion on website conversion optimization outcomes, make sure you attend the Modern Retailing Conference (MRC) in Palm Beach as we share insights from optimizing hundreds of websites from dealers who participated in the Automotive Website Conversion Optimization Project.
Measuring Conversions & Engagement in Google Analytics
Before we share the summary findings from the dealers we studied, it is important for dealers to understand how lead conversions are recorded in Google Analytics (GA4) vs lead counts in the CRM. The count of sales leads will always be higher in GA4 compared to lead counts in the CRM, and we will explain why in greater detail.
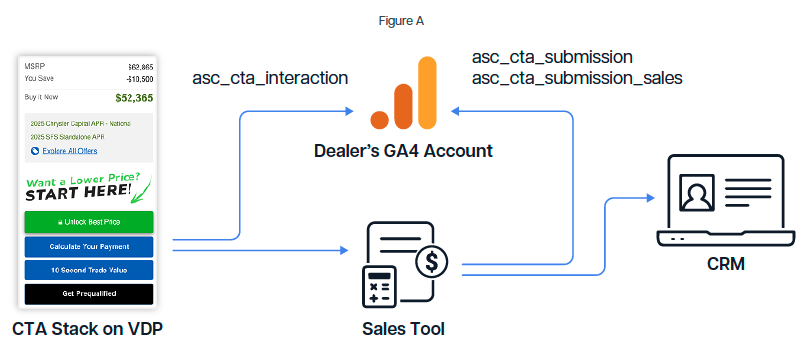
When a consumer clicks on a CTA button to start a trade, payments, or credit workflow, the software vendor or the website platform will send an event in Google Analytics called asc_cta_interaction. The event can also include the name, color, and position of the button on the page.
In the example above, when a consumer clicks the CTA called “Calculate Your Payments,” the TradePending workflow starts and soon the consumer can provide their contact information. When the payment form is completed and the consumer clicks on “submit,” the software vendor must send an event into Google Analytics called asc_form_submission and asc_form_submission_sales.
Dealers can take the number of form conversions created by each CTA workflow and divide that by the number of CTA button clicks to get the CTA Completion Rate (CCR). A high CCR indicates that the consumers find the tool easy to use and were willing to exchange their data for something in return.
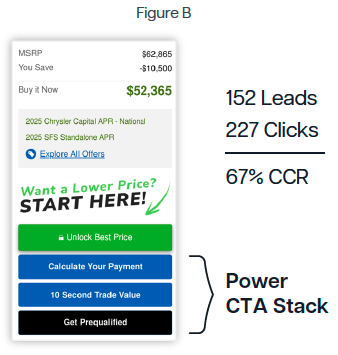
Let’s look at an example of how to do the CCR math for a Trade CTA shown in Figure B.
Looking in Google Analytics, there were 227 clicks in July on the CTA button labeled “10 Second Trade Value” (asc_cta_interaction) which started the TradePending trade process.
There were 152 form conversions from the trade tool (asc_form_submission_sales). The CCR is 152 divided by 227 = 67%. Approximately 7 out of 10 people who started the trade process completed all steps.
We are taking time to explain this math because the dealer will not see 152 leads in their CRM.
How CRMs Process Website Leads
Let’s say that the CRM only shows 112 leads for TradePending’s trade tool for the given time period and not 152 which was logged in GA4 (Fig. B). A dealer could think that the trade tool was underperforming or they might think that the TradePending reports are overreporting success metrics. However, we discovered that the CTA stack design impacts who gets credit for the lead. If dealers have lead gates on a vehicle’s selling price, more consumers will likely enter their information on the form associated with the price unlock (i.e., Unlock Best Price) before trade, payments, or credit. Since the unlock price leads would likely hit the CRM first, any trade, credit, or payment lead will not be associated in the CRM lead source report as TradePending. This is the same limitation with any CRM because of first click attribution models which generate skewed lead performance reports.
CRM lead conversion reports provide valuable data, but dealers should never use them as the sole measure of their website tools or marketing campaigns’ success.
However, the price unlock conversion is not a true exchange of value, which masks the value of subsequent leads generated by retailing tools which offer an exchange of value for customer data. It is important for dealers to properly weigh the signals they received from payment and trade tools over simple price unlock leads.
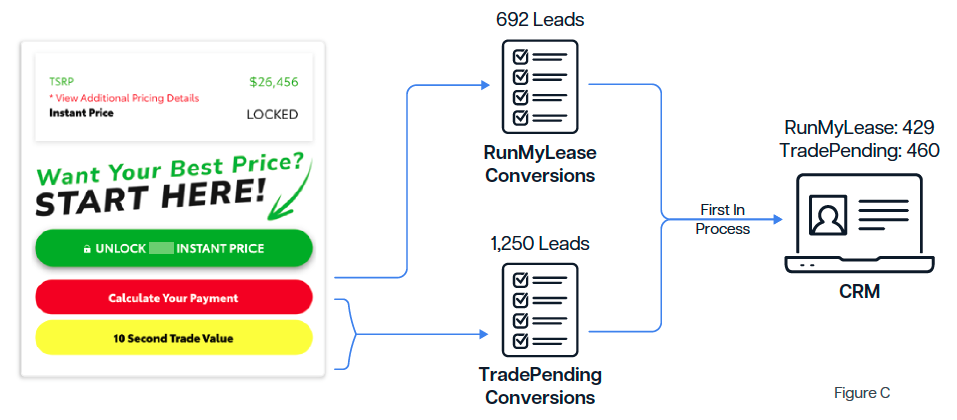
Here is an example (Fig. C) of how bad the masking can be when a simple unlock is used to capture customer information, not shopping intent. We can see that 1,250 leads were sent into the CRM from TradePending retailing software but according to the CRM, TradePending only had 460 leads. The unlock instant price CTA takes the initial lead credit in many examples we analyzed, with trade or payments coming in minutes later.
Despite the masking, TradePending was the #1 lead source for the majority of stores in the Morgan Auto Group (75 stores) and these lead signals are sent to the CRM with the hope that the sales associate will see the duplicate lead signal and acknowledge that the consumer submitted a trade or calculated their payments.
What we also discovered is that CRM platforms are not designed to trigger new workflows or messages based on the second or third lead source, which may have higher value than the first lead source. The first CRM that comes up with fluid communication with audiences based on weighted lead sources will stand out from the competition.
How Many People Complete the RunMyLease Unlock?
I’m sure that some readers are asking about the CTA Completion Rate (CCR) for the green unlock price CTA. The CCR will depend on the math box and pricing which is disclosed, so here are a few examples of CCR calculations for a simple price unlock which requires the consumer to allow a text message to be sent to their phone to confirm that their data is correct.
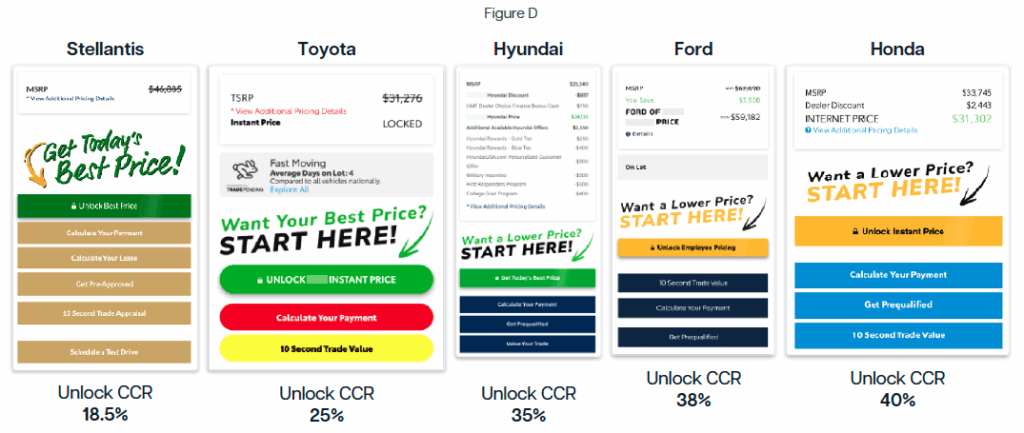
The range of CCR for the same CTA message is very large. This begs that additional research be done to understand the impact of extra CTA buttons (i.e., Stellantis example) or the OEM brand messaging on the website.
What Happens to Website Conversion When Payments Are Added?
We looked at stores which already had the TradePending Trade CTA who decided to add the TradePending Payments and Credit CTA buttons. The stores replaced their digital retailing CTA in the April / May timeline when it was permissible by the OEM. In some cases, there were two payment tools on the dealer’s VDP (i.e., eShop or Capital One).
All stores who switched out their digital retailing tools with the TradePending Power CTA stack saw a net increase in form leads.
The Power CTA stack was a strategic win for the Morgan Automotive Group with two stores seeing a 100% net increase in form leads. What was interesting for the Honda store is that their overall percentage of TradePending leads was still low.
When we looked at the data, it was because the Honda store added a CapitalOne digital retailing CTA in June to calculate payments (Fig. F). We’d also advise dealerships to pick one tool to do a single job for a customer. Having multiple CTAs that can perform the same function, like calculating a payment, is confusing for the consumer and clutters the page with duplicative CTAs.
The TradePending Payments tool generated 110 leads and Capital One generated 134. The addition of Capital One was a net increase of total leads although some conversions were diverted away from TradePending because of the prominent positioning and branded logo on the CTA button.
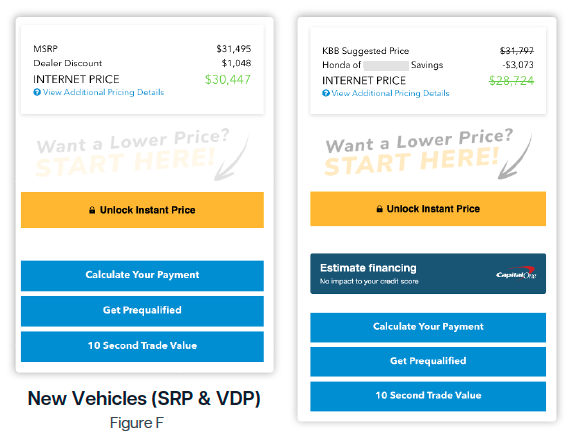
This reinforces the need to calculate CCR in Google Analytics to see that lead source data can be influenced by CTA designs, conflicting vendor tools, and a price unlock feature.
Trade and Payment CCRs are Different
It is important to understand that the more data requested from consumers in a web form or online sales process will decrease the number of leads.
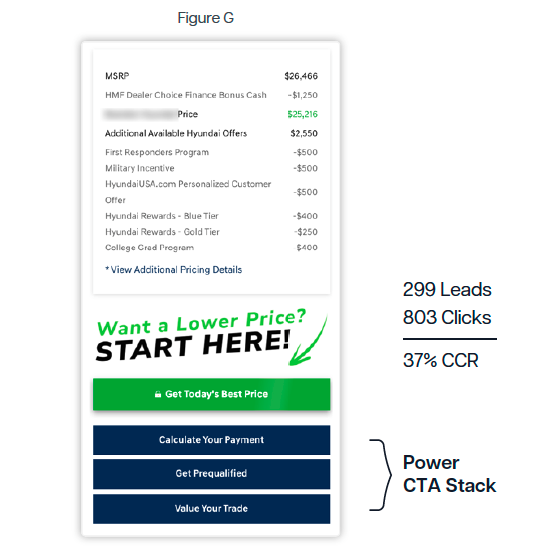
In the case of one Hyundai store with a simplified CTA, shown here (Fig. G), the CCR for the payments CCR was computed as follows for the month of July:
299 payment leads / 803 clicks on
“Calculate Your Payment” = 37%
The payment leads were high quality and quantity. They also closed at a very strong rate which makes the true value of their CTA stack. When any online process is longer than a streamlined market report workflow in the “Value Your Trade” CTA, the CCR will be lower.
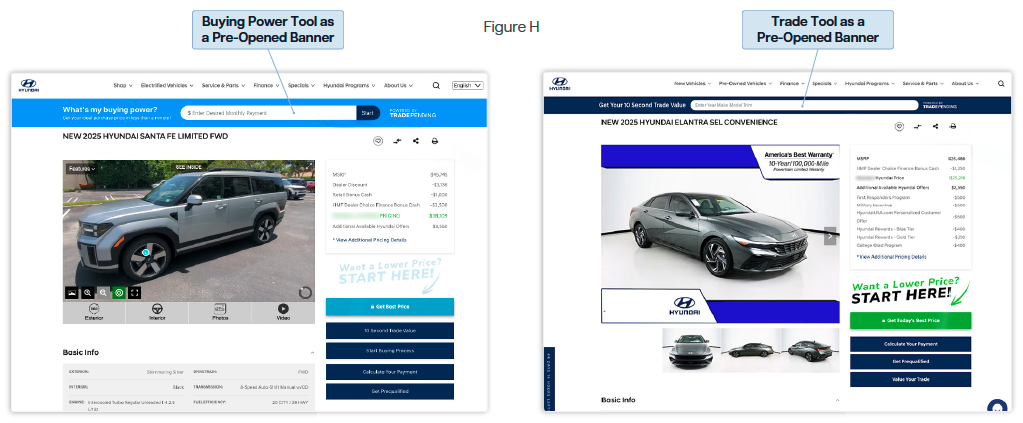
Overall Conversion Also Impacted by Design
Some of the dealers we studied had the TradePending Power CTA Stack as shown above (Fig. G) but also added additional “pre-opened” TradePending tool options as shown below (Fig. H). The integration of CTA buttons and pre-opened tools appears to generate additional “net new” leads for dealers. We have asked TradePending to upgrade their support of the ASC specification to indicate when pre-opened forms are started so we can more accurately measure total CCR.
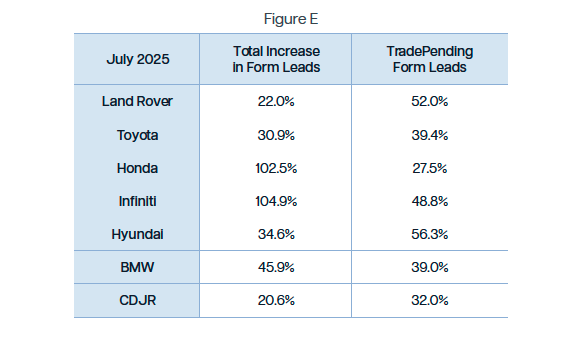
Variations by OEM Brand
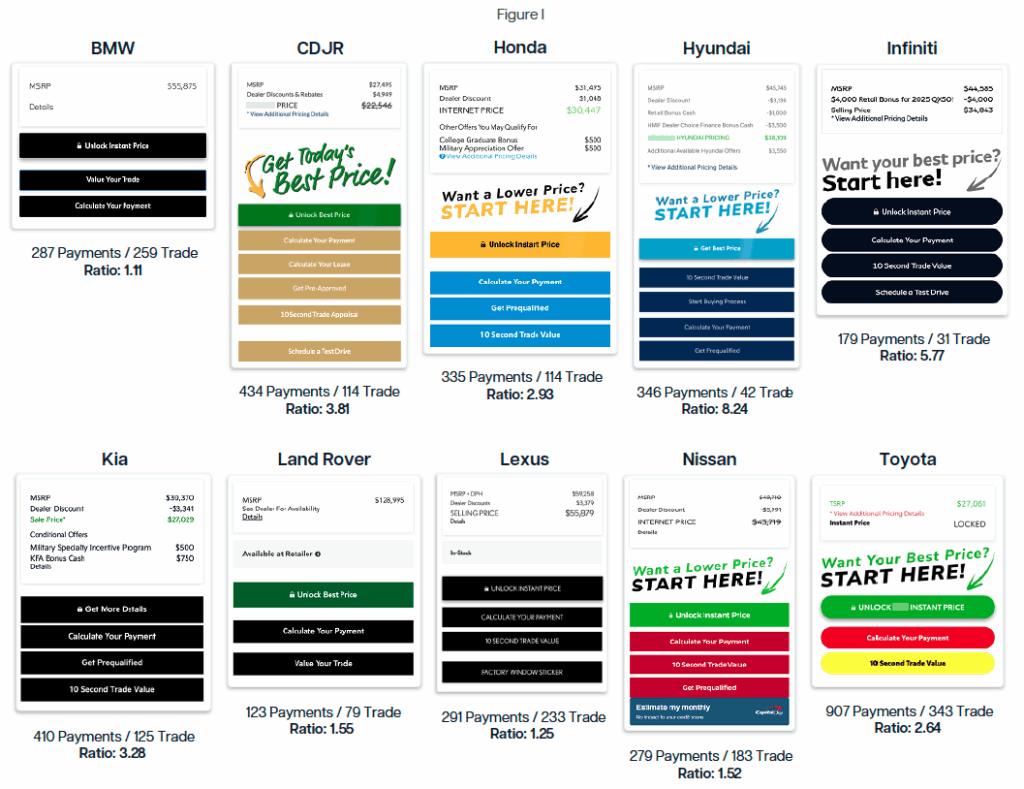
The ratio of payment leads to trade leads was another data point which we inspected, and as you can see below (Fig. I), the ratio varied greatly. The Hyundai store had the lowest number of trade leads compared to payments, and luxury brands like Land Rover, BMW, and Lexus had the highest number of trade leads as a percentage.
Additional research will be coming on the colors, designs, and number of CTA buttons used which may impact overall conversion rates.
General CTA Suggestions
By studying dealer website designs for many years, we have seen hundreds of different designs and CTA approaches. If success is to be measured by the number of leads generated by a website page design, and not page load speed, then we have some suggestions to consider. We challenge dealers to consider if they have a clear sales process on their website which matches their sales experience in the showroom.
- The primary CTA button should stand out on the page, so if the OEM allows it, the button should be a different color.
- There is no value to having more than five CTA buttons on a VDP.
- If the primary CTA button has no real exchange of value (i.e., only a reduced price) or “check availability”, dealers need to measure the CCR to see if the consumers are not playing the lead game. For example if the CCR is under 25%, is that CTA worth disappointing 75% of hoppers?
- The CTA buttons should reflect the primary research questions of a shopper, which often comes down to answering this question: can I afford this vehicle?
- If affordability is a primary concern the shopper will want to know 1) The finance rate they qualify for; 2) Their monthly payments based on a reasonable downpayment; 3) The value of their trade. Thus having three CTA buttons for these questions makes practical sense.
- Consumers rarely schedule a test drive via a CTA button, so remove it.
- Reconsider the ‘Check Availability’ CTA to be used only on used car VDPs. The CCR on used car pages is < 20% and significantly less on new car pages, so eliminate it on new car VDPs.
- Do not have two different trade tools on your VDP or website.
- If you have two digital retailing tools on a VDP verify that both tools are generating equivalent offers, rebates and payments. If the tools present conflicting data, remove one.
- Test your VDP designs on a mobile phone:
- See if the CTA buttons are of similar size and are aligned properly
- See if your chat pop-up is covering up your CTA stack or is popping up too much to cause friction with the consumer.
- See if your website vendor has added a “call us” CTA button on a VDP. If yes, make sure the button is sending ASC events so you can see if consumers are using this dynamic CTA button. You should also make sure this CTA is using a DNI phone number.
- See how much scrolling is needed to get to the CTA stack and does the CTA stack fit onto one screen.
Closing Thoughts
More work is needed to study the impact on conversion rates and CTA design. When the primary CTA button is a basic unlock, the CCR rates are very low. In fact, most “unlock” CTA messages have a CCR lower than 25%. This means that 75% of the consumers who wanted to know the selling price of the vehicle did not want to exchange their contact information. This is a strong statement about payment disclosing strategies.
TradePending Power CTA Stack has extremely high engagement rates and provides consumers with an exchange of value. This exchange creates higher quality leads because it shows the consumer is more committed to the transaction other than just seeing a selling price.
With CCR rates at 67% and higher for trade, and 37% and higher for payments, dealers can see that consumers are finding these retail workflows extremely easy to use and valuable in their shopping journey. When dealers compare these metrics with their current retail CTA messages and software, they will be able to see a clear path forward to higher conversion rates.